
In the last year, we’ve made impressive leaps in terms of malt in beer. We found a standard method for extracting malt flavor. We designed the Base Malt Flavor Map, which creates a common language everyone along the supply chain, from growers to maltsters to brewers can use. These are the building blocks that’ll go a long way in creating more flavorful malt for craft brewers to weave into their recipes — and for you to enjoy in your glass.
Our investigations and explorations into the U.S. malt supply come at a time when U.S. acreage of barley has declined 40 percent over the past few decades. This has created a supply chain that is largely focused on growing malt barley, not feed. The opportunity to shape this supply of malt barley for the needs of independent craft brewers is ripe.
Across our American food landscape, people are starting to care about grains and their properties. Waving grain is once again enticing us to imagine new ways to learn and create. By focusing on flavor and the needs of craft brewers, we are defining what barley will look and taste like for the next several decades.
(READ: Fact, Fiction and How IBUs Impact on Your Beer)
How Much Does Base Malt Flavor Matter?
How much does base malt flavor matter in beer? Over the past year, Briess Malt, New Belgium Brewing and Valley Malt collaborated on a study to answer this very question. The overall objective was to determine if a malt that has preferred flavor would translate to a beer that has preferred flavor.
The study culminated in a live collection of preference data from the 189 homebrewers who attended Cassie Liscomb’s National Homebrewers Conference (NHC) seminar titled “The Relationship Between Base Malt Flavor Preference and Beer Flavor Preference: Does Base Malt Flavor Matter?” The results could not have been more exciting, at least for malt sensory nerds like ourselves.
Methods
We chose two pairs of malt samples for our study. The first pair represented a potentially small difference in flavor preference and was identified as Malt A vs. Malt B. The barley used to produce these malts differed in variety and crop year, but were grown in the same region of the United States and malted in the same malthouse following the same recipe. The resulting malts only differed analytically in terms of protein content.
We chose the second pair of malt samples to represent a potentially large difference in flavor preference and identified them as Malt C vs. Malt D. The barley used to produce these malts differed in variety, crop year, growing region, malting location, and malting recipe. The only analytical similarity between the resulting malts was Lovibond color and wort pH.
(READ: The Beer Flavor Map Revolutionizes Beer Flavor Terminology)
The malts were used to brew four single malt, Helles-style beers, with brewing conditions controlled so that the only variable was the malt itself. The beers were produced by Briess Pilot Brewers/Technical Service members Dan Bies and Jordon Geurts in the Briess pilot brewery.
Malt samples were prepared for sensory evaluation using the ASBC Hot Steep Method, the new procedure our team developed for the sensory evaluation of extractable malt flavors and aromas. Beer samples were evaluated after bottling. Both the malt and beer samples were evaluated for flavor preference following the Paired Comparison Test.
Our Results
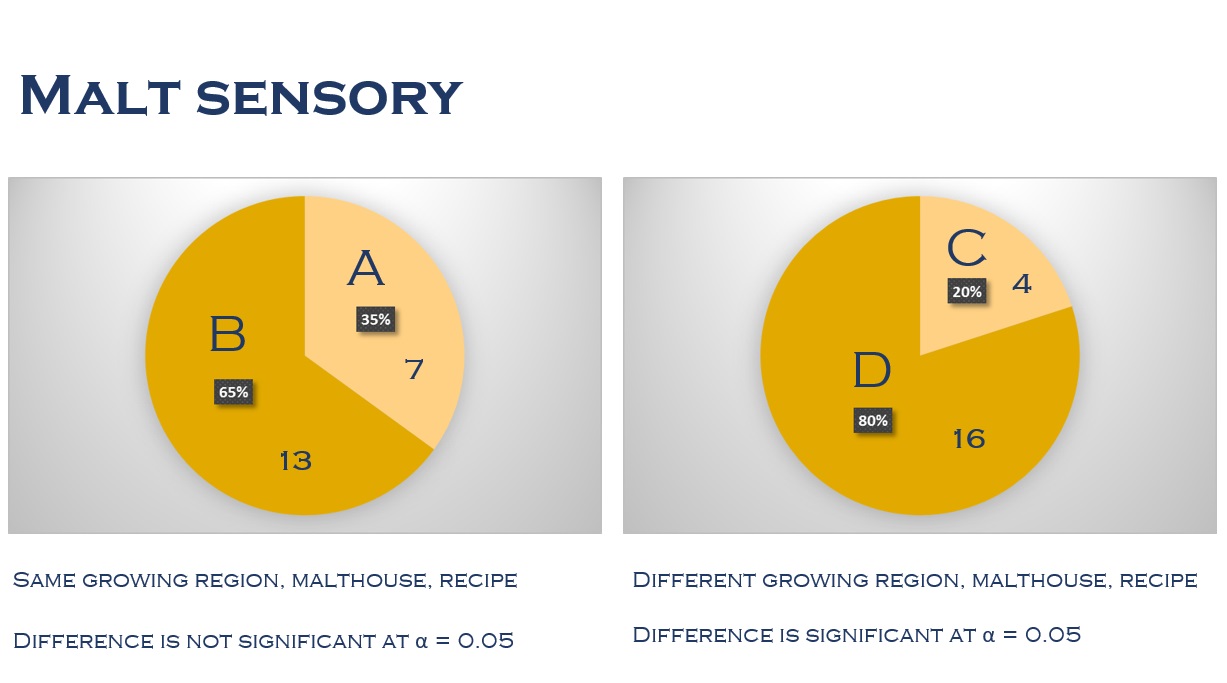
The collaborative sensory panel consisted of 20 tasters from Briess Malt, New Belgium Brewing and Valley Malt. For the first malt pair, seven tasters preferred Malt A and 13 preferred Malt B (the difference is not significant). For the second malt pair, four tasters preferred Malt C and 16 preferred Malt D (the difference is significant!). The pie charts below you give you a closer look at the results.
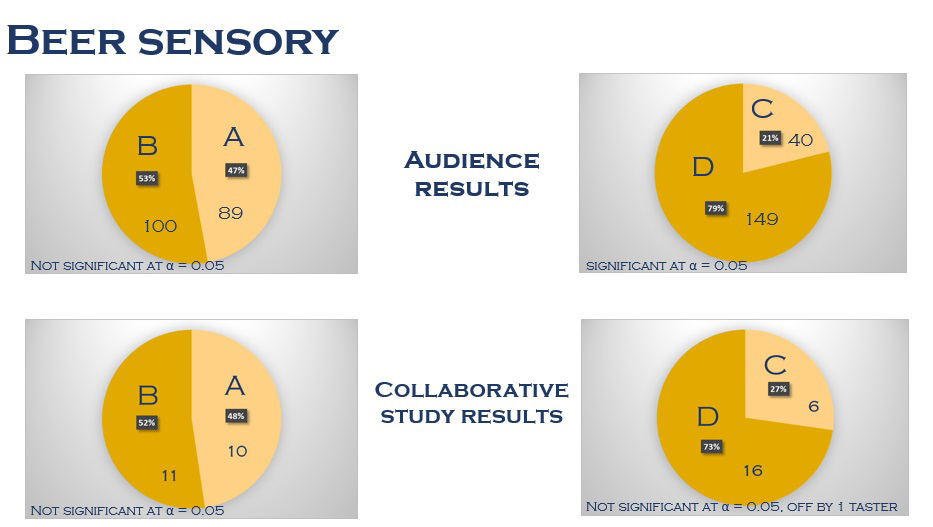
We observed a similar trend of results in the beer brewed from these malts. For the first beer pair, 10 tasters preferred Helles A and 11 preferred Helles B (that difference is not significant for research purposes). For the second pair, six tasters preferred Helles C and 16 preferred Helles D (again, that difference is not significant, although a split of five vs. 17 would have been).
(LEARN: CraftBeer.com’s Big Glossary of Beer Terms)
During Cassie’s NHC Seminar, the four Helles-style beers were served to everyone in attendance per the Paired Comparison Test. The audience data was submitted live through an online survey and the results were reported at the end of the presentation. On a percent breakdown of responses, the NHC audience results were nearly identical to those produced in the collaborative study! For the first beer pair, 89 tasters preferred Helles A and 100 preferred Helles B. For the second beer pair, 40 tasters preferred Helles C and 149 preferred Helles D (the difference is significant). You can see the results in the pie charts below.
Conclusions
In the study of a lager beer where hops and yeast minimally contribute to the overall flavor profile of the beer, base malt flavor truly did matter! The originally stated objective of our collaborative study was to determine if a malt that has preferred flavor would translate to a beer that has preferred flavor. What we found was even more interesting: there not only appears to be a relationship between malt flavor preference and beer flavor preference, but a relationship between non-preference as well.
(LEARN: CraftBeer.com’s Big List of Beer Schools)
The Future of Malt Sensory Research
Our Malt Liking Study is just one of many projects that can stem from the adoption of the Hot Steep Method and Base Malt Flavor Map (which you can read about in-depth here). This research will answer some fundamental questions, but will also create an awesome opportunity for continued collaboration among people in our supply chain.
In 2018, we will embark on research that will involve barley breeders and help answer the powerful questions of variety and flavor. A preliminary research design includes several malting barley varieties, grown in two to three different locations, from three different crop years. Once malted, the impact of malt characteristics influenced by variety versus location versus growing year will be investigated.
About the Authors: Lindsay Barr is a Sensory Specialist at New Belgium Brewing Company and Co-Founder of DraughtLab Sensory Software. Cassie Liscomb is a scientist who works in the Technical Services Department at Briess Malt & Ingredients.; Andrea Stanley is the Owner/Maltster of Valley Malt.
CraftBeer.com is fully dedicated to small and independent U.S. breweries. We are published by the Brewers Association, the not-for-profit trade group dedicated to promoting and protecting America’s small and independent craft brewers. Stories and opinions shared on CraftBeer.com do not imply endorsement by or positions taken by the Brewers Association or its members.
Share Post